Category Archives: Network Notebook

Semi-structured notes on my Ph.D. thesis work on network science. For an intro, see http://youtu.be/KKrM2c-ww_k

Salzburg Global Seminar: a social network of session 593

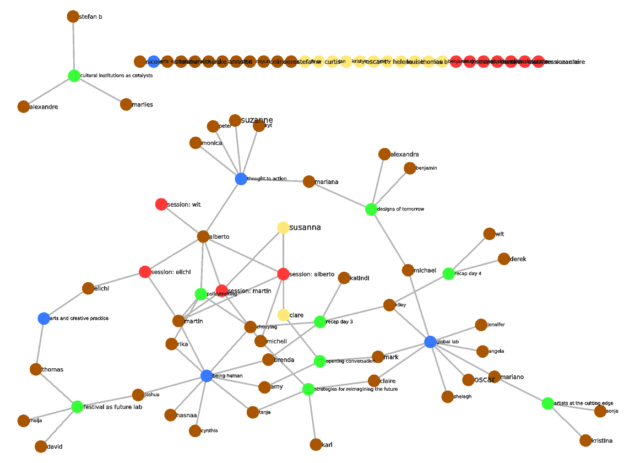
Folks at the Salzburg Global Seminar were kind enough to show interest in (or at least tolerate) my obsession for social networks and semantic social networks. So, I made a social network of our session, called “session 593” (a nice prime number, as Martin Bohle pointed out).

It works like this. There are five types of nodes: fellows (brown), staff (yellow), plenary panels (green), focus groups (blue) and impromptu breakout sessions (red). Staff and fellows “vote” participating in focus groups and breakout sessions. Additionally, SGS assigned many of us to plenary panels with others. Edges in the network are interpreted as “fellow X participated to event Y”.

The data are wildly incomplete. I compiled the lists of fellows, staff, and plenary panels from the program; the list of focus groups I made on the fly on the last day. The program also has data about who participated in which panel, so that’s there. Kiley’s latest two recaps count as panels, because she involved others in them (Katindi, Brenda, Zhouying…). As for the focus group compositions, I obviously knew the one I participated in, thought to action; I also was able to add two more (being human and global lab), based on the tables on the final session. I had started to map the arts and creative practice , but then the facilitator asked us to stand up and move the table, and there went my data integrity 🙂 I also do not know who participated into which session, except for a few (Martin’s, Eichi’s, my own…).

If the data were complete, you could start looking through which sessions connected who, which people spent lots of time together (this is done through a technique called projection), and even, with some reflection, who should have spent time together but did not – the missing edges in the network. With the incomplete data, it turns out that the global lab focus group had the highest eigenvector centrality (a measure of centrality that reflects the centrality of connecting nodes, like Google’s PageRank algorithm). It is also the session with the most participants.

If you were at SGS session 593, and are curious as to what this might look like, I am happy to try to complete it. I also vow to beautify it a bit – makes for a cool pic to put on your blog. I will need:

  1. From everyone, which focus group they participated to.
  2. From people who held breakout sessions, who came to their session.

I will update it as I receive data from you. I predict that the complete data would see a high centrality of Claire (Nelson) and her Moonshot session. 🙂

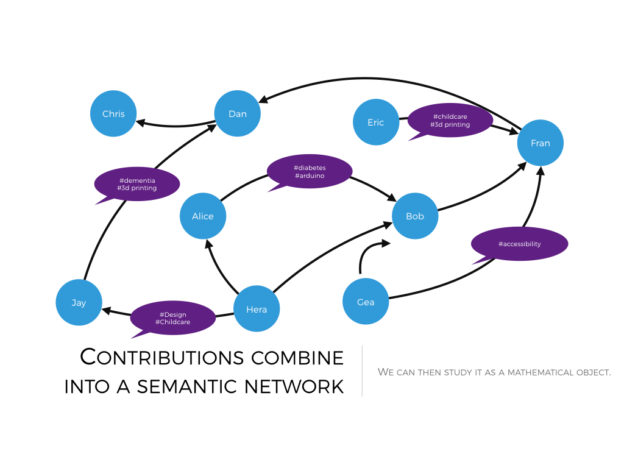
This network has no semantics, it’s just a social network. But still, networks speak to many people, myself included, and anyway doing something like this is easy.

If you are in the network, and prefer not to be included in the network, let me know and I will remove you at once.

The Horizon 2020 tribes. Partnership building and network assortativity in European research funding

Highly innovative economies are characterised by intense cooperation between academia and industry. It makes sense: university researchers are good at discovery and invention, industry engineers are good at product and business development. Together, they have more chances of coming up with innovative products and bringing them to market. So, many governments would like to see more of it. They have rolled out policies to encourage academics and business people to work together across the culture chasm.

Horizon 2020 is one such policy. With its 80 billion Euro budget, it is the European Union’s flagship research and innovation funding programme. It is an interesting point of observation on cooperation between industry and academia because of its size, and also because it grants funding not to individual organisations, but to consortia. Each consortium is an opportunity for academia and industry to work together. To what extent do European universities and companies seize those opportunities? How effective is Horizon 2020 in bringing together academia and industry?

With my sisters- and brothers-in-arms in the Spaghetti Open Data community we have tried to address these questions. We started this work as a hackathon track at Open Data Fest, in June 2017. Here’s what we did it and what we found out.

What we did

  1. Fortunately, the data on funding under Horizon 2020 are open. We downloaded the CORDIS dataset from the European Open Data Portal. Our dataset includes 16,592 organisations and 11,068 projects.
  2. We used them to induce a network. Its nodes are the 16,592 organisations. Two organisations are connected by an edge if they participated in at least one project together. There turn out to be 493,014 edges in this network.
  3. We filtered the network to include what we call “stable partnerships”. Two organisations are said to have a stable partnership if they participated together in at least two Horizon 2020 projects. Organisations that have  no stable partners were dropped. This yielded a network with 3,414 nodes, and 46,632 edges. It is important to note that, for computational reasons, there are two edges for each connected pair of organisations (A, B) in the network: one that connects A to B and the other that connects B back to A. Edges can be interpreted as decisions to build a stable partnership: A has decided to participate in more projects in which B is present, and B has made the same decision with regard to A.
  4. CORDIS data distinguish between five types of organisations: private companies (PRC) , higher education establishments (HES), research organisations (REC), public sector (PUB) and others (OTH). With this information, we could look at the patterns of partnership generation within and across types of organisations.

What we learned

Organisations in Horizon 2020 show a marked preference for partnering with other organisations of the same type. This pattern of behaviour is called assortativity, and is common in many social networks. However, it plays out in very different ways across different types of organisations.

Type % edges w/orgs of same type (actual) % edges w/orgs of same type (random) % Difference
PRC 45 40 +5
HES 59 18 +41
REC 38 22 +16
PUB 46 10 +36
OTH 14 8 +6
ALL 46 26 +20

The second column of this table shows how many within-type partnerships we actually observe. Organisations of type PRC (companies) choose to partner up with other PRCs 45% of the times. Organisations of type HES (universities) choose to partner up with other HESs 59% of the times, and so on.

The third column show what these percentages would be if organisations were to chose partners at random from the population of Horizon 2020 participants. Choosing partners at random of course makes no sense: but it gives us a useful mathematical benchmark to compare our observations against. Companies, for example, account for 40% of all the organisations in the stable partnership network: so, if they choose a partner at random, they will pick another company 40% of the times. The difference between observed choice and random choice (45% – 40% = 5%) is a measure of the preference for in-type partnership of each type of organisations.

This preference is strong for the network in general, but weak for companies and very strong indeed for public sector organisations and, especially, universities. You can perceive it visually, by looking at the picture that opens this post: edges are grey when they connect partners of different types. When they connect partners of the same type, take the color of that type, shown in the legend. There are very clear clusters of public sector organisations (yellow) and, right in the center of the action, universities (blue).

These organisations obviously see some advantage in investing mostly on partnerships within their own “tribe”.  This tendency is an indicator the width of the cultural chasm that academics and business people need to overcome if they are to work together.

How effective is the set of incentives incorporated in Horizon 2020 in overcoming it? Not very effective, it turns out. Out of the 46,632 edges in the stable partnership networks, only 3,254 (7%)  involve one company and one university. This is exactly half of the partnerships of this type you would get if organisations were to choose their partners at random. To give a visual appreciation of this, we drew the network, and coloured the edges connecting universities and company in red.

The giant component of the Horizon 2020 stable partnership graph. Red edges encode a partnership between a university and a company.

The giant component of the Horizon 2020 stable partnership graph. Red edges encode a partnership between a university and a company.

Thanks to Open Data Sicilia (especially the mighty Giuseppe La Mensa) and Spaghetti Open Data for organising the hackathon. Thanks to Baya Remaoun, web and data manager at CORDIS, for her support.

Code, data and images are available on GitHub. You can find a more detailed explanation of this and other paths of exploration across the CORDIS dataset on the wiki. You are free to use this post and the GitHub repo under the terms of the respective licenses, but if you want to write a paper about this please consider involving me as a co-author.

The quest for collective intelligence: a research agenda

I am knee deep into the research work for opencare. I think I am learning new things on how to use collective intelligence in practice. This has far-reaching implications for my own work in Edgeryders, and beyond.  Far beyond, in fact. If we crack collective intelligence, we gain access to a new source of cognition. Forget my own work; this has profound implications for the future of our species. If you think that’s radical, go read the work of cultural evolution scholars, like Boyd, Richerson or Henrich. They think homo sapiens has started a major transition: evolutionary forces are pulling us towards a larger, more integrated “collective brain”. We are en route to becoming to primates what ants are to flies.

Collective intelligence is an elusive concept. It appeals to intuition, but it is hard to define and harder to measure and model. And yet, model it we must if we are to go forward. The good news is: I think I see a possible way. What follows is just a  back-of-the-envelope note, plotting a rough course for the next three years or so.

1. Data model: semantic social networks

I submit that the raw data of collective intelligence are in the form of semantic social networks. By this term I mean a way to represent human conversation. The representation is a social network, because it involves humans connected to each other by interactions. And it is semantic, because those interactions encode meaning.

2. Network science: it’s all in the links.

Collective intelligence is not additive: it’s interactional. We can only generate new insight when the information in my head comes into contact with the information in yours. So, what makes a collectivity more or less smart is the pattern of linking across its members. Network science is what allows a rigorous study of that linking, looking for the patterns of interaction which associate to the smartest behaviors.

3. Ethnography: harvesting smart outcomes

Suppose we accept that the hive mind can generate powerful insights and breakthroughs. How can we, individual human beings, lift them from the surrounding noise? Looking at what individual members of the community say and do would likely be fruitless. The problem is understanding how the group represents to itself the issue at hand; no individual you ask will be able to hold all the complexity in her head. We do have a discipline that specializes in this task: ethnography. Ethnographers are good at representing a collective point of view on something. Their skills are useful to understand just what the collective intelligence is saying.

4. “Shallow” text analytics: casting your net wider

Ethnography is like a surgical knife: super sharp and precise. But sometimes you what you need is a machete. As I write this, the opencare conversation consists of over 300,000 words, authored by 137 people. This is a very big study by ethnography standards, and these numbers are likely to double again. We are already pushing the envelope of what ethnographers can process.

So, the next step is giving them prosthetics. The natural tool is text analytics, a branch of data analysis centered on text-as-data. It comes in two flavors: shallow-and-robust and deep-and-ad-hoc. I like the shallow flavor best: it is intuitive and relatively easy to make into standard tools. When the time of your ethnographers is scarce and the raw data is abundant, you can use text analysis to find and discard contributions that are likely to be irrelevant or off topic.

5. Machine learning: weak AI for more cost-effective analysis

Beyond the simplest levels, text analytics uses a lot of machine learning techniques. It comes with the territory: human speech does not come easy to machines. At best, computers can evolve algorithms that mimic classification decisions made by skilled humans. A close cooperation between humans and machines just makes sense.

6. Agent-based modelling: understanding emergence by simulation

We do not yet have a strong intuition for how interacting individuals give rise to emergent collective intelligence. Agent-based models can help us build that intuition, as they have done in the past for other emergent phenomena. For example, Craig Reynolds’s Boids model explains flocking behaviour very well.

The above defines the “long game” research agenda for Edgeryders. And it’s already under way.

  • I am knee-deep in network science since 2009. We run real-time social network analysis on Edgeryders with Edgesense. We have developed an event format called Masters of Networks to spread the culture beyond the usual network nerds like myself. All good.
  • We collaborate with ethnographers since 2012. We have developed OpenEthnographer, our own tool to do in-database ethno coding I’d love to have a blanket agreement with an anthropology department: there is potential for groundbreaking methodological innovation in the discipline.
  • We are working with the University of Bordeaux to build a dashboard for semantic social network analysis.
  • I still need to learn a lot. I am studying agent-based modelling right now. Text analytics and machine learning are next, probably starting towards the end of 2016.

With that said, it’s early days. We are several breakthroughs short of a real mastery of collective intelligence. And without a lot of hard, thankless wrangling with the data, we will have no breakthrough at all. So… better get down to it. It is a super-interesting journey, and I am delighted and honoured to be along for the ride. I look forward to making whatever modest contribution I can.

Photo credit: jbdodane on flickr.com CC-BY-NC