Archivio tag: analisi di rete

Due comunità online a colpo d’occhio: Edgesense cresce

Durante l’estate, il gruppo di Wikitalia ha lavorato duro per perfezionare Edgesense, il tool per l’analisi di rete in tempo reale delle comunità online che stiamo costruendo nell’ambito del progetto CATALYST. Mentre noi lavoravamo sulla nostra comunità tester ufficiale, quella di Matera 2019, è successa una cosa bella: mi è capitato di parlare di Edgesense con Salvatore Marras, e lui mi ha chiesto di provarlo su Innovatori PA. Edgesense è appena in alpha, ma la curiosità di vedere come si sarebbe comportato su una comunità molto più grande di quella di Matera 2019 (oltre diecimila utenti registrati!) è stata troppo forte.

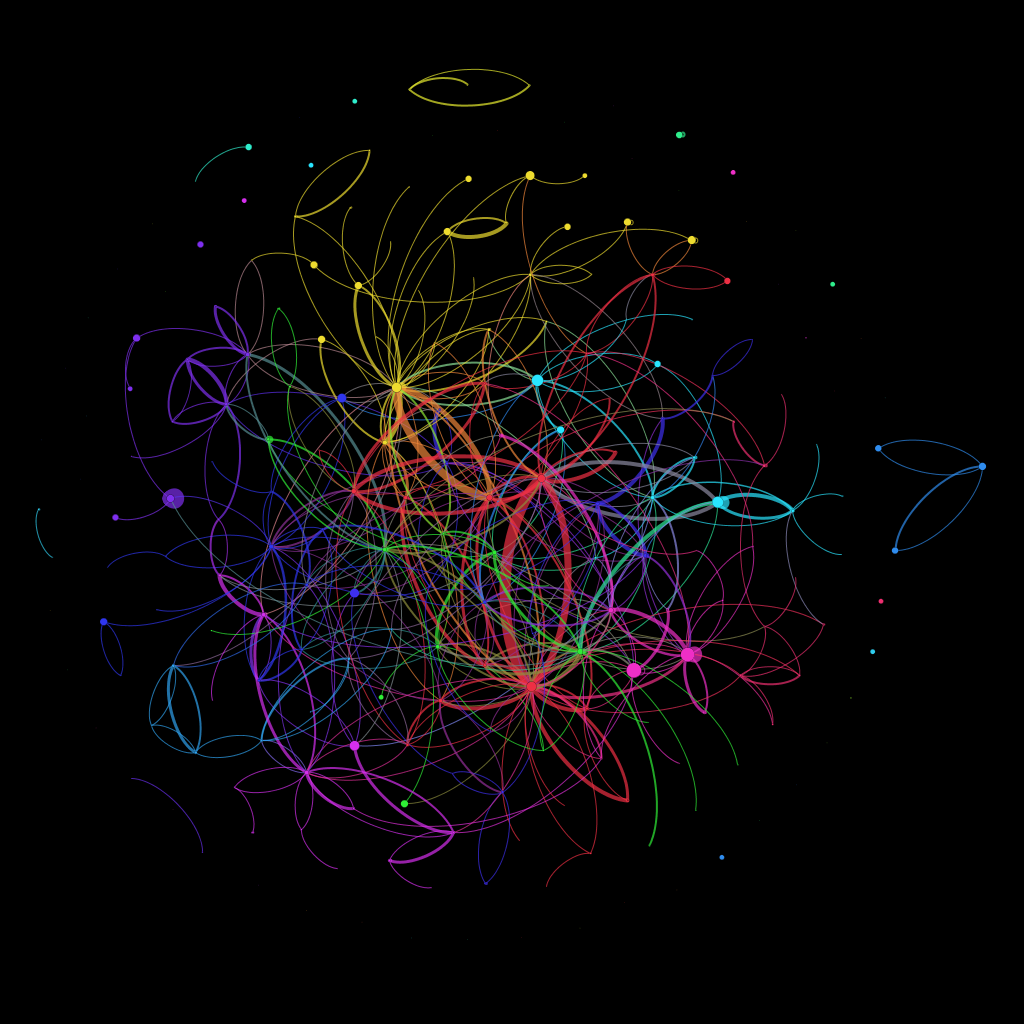
Sorpresa: nonostante usi lo stesso software di Matera 2019, Innovatori PA non è solo più grande: è proprio diversa. Sorpresa ancora più grande: Edgesense ti permette di vedere la differenza a occhio (clicca qui per un’immagine ingrandita).

Anche le metriche confermano. Innovatori PA, che ha oltre 700 nodi attivi (cioè che hanno contribuito scrivendo post o commenti), dà luogo a una rete piuttosto sparsa, con “solo” 1127 relazioni. La distanza media è piuttosto alta, 3.76 gradi di separazione (se si pensa che Facebook ne ha solo 4.74 – fonte); la modularità, cioè la naturalezza con cui puoi dividere la rete in sottocomunità (Edgesense le distingue per colore) è molto alta.

Viceversa, la comunità di Matera 2019 dà luogo a una rete abbastanza connessa, 872 relazioni , quindi l’80% di quelle di Innovatori PA, ma con meno un terzo dei partecipanti. I gradi di separazione medi tra due partecipanti sono solo 2.50, e la modularità è molto più bassa.

Se volete divertirvi a giocare con Edgesense – tra le altre cose vi permette di vedere la crescita della rete nel tempo – andate qui per Matera 2019. Non c’è bisogno di installare niente, si accede attraverso il browser. Vi consiglio il tutorial che abbiamo preparato per insegnare in modo interattivo i rudimenti dell’analisi di rete per le comunità online (trovate un link “tutorial in alto a destra nella pagina). L’installazione di Innovatori PA è ancora un po’ ballerina, ma a breve verrà resa disponibile.

La tua comunità online è sostenibile? Un approccio network science


Negli ultimi anni abbiamo assistito alla tendenza, da parte di agenzie governative, autorità regionali e locali e istituzioni pubbliche in genere, a lanciare comunità online. Per molte ragioni (il desiderio di avvantaggiarsi dell’intelligenza collettiva in rete; il bisogno di rilegittimarsi attraverso la partecipazione aperta; lo sforzo top-down per modernizzare le politiche pubbliche) probabilmente continuerà a succedere. Questo, però, solleva il problema dei finanziamenti. Quanto costano davvero le comunità online del settore pubblico? Come evolvono nel tempo i loro costi di funzionamento? Alcuni commentatori pensano che mantenere in piedi attività di coinvolgimento dei cittadini online costi molto poco – dopo tutto, il citizen engagement è l’equivalente dell’user generated content; sono attività realizzate dagli utenti, quindi a costo marginale zero. Ci possono essere costi significativi per mettere in piedi queste attività, associati all’acquisto e alla configurazione di tecnologia, e all’investimento in attività di startup: ma poi uno può rilassarsi e godersi il volo.

La mia esperienza, e quella di molti colleghi, è che questo sia largamente un mito. Probabilmente è vero per comunità molto grandi, in cui anche una minoranza di utenti attivi, anche se piccola in proporzione, è grande in assoluto e fa massa critica. Ma le comunità online delle pubbliche amministrazioni generalmente sono piccole: meno di mille persone per la mobilità a Milano, poche migliaia per la collaborazione peer-to-peer sui business plan di progetti creativi, forse qualche decina di migliaia in qualche altro progetto. Troppo piccole per sostenersi da sole. L’ho imparato sulla mia pelle, quando l’incertezza amministrativa ha quasi distrutto la comunità vibrante di Kublai.

Ma, se le comunità online orientate alle politiche pubbliche non sono in genere sostenibili al 100%, molte mostrano i segni di una sostenibilità parziale – e quindi, a parità di altre condizioni, di vantaggi di costo. Questo è certamente vero di Kublai: quasi tre anni di incertezza amministrativa e false partenze, a fondi zero o quasi, hanno ferito la comunità ma non l’hanno distrutta. Dava ancora segni di vitalità a luglio 2012, quando finalmente il nuovo team ha preso servizio. Quindi, come possiamo misurare il grado di sostenibilità di una comunità online? (Continua in inglese)

An intuitive way to do it is to look at user generated content vs. content created by paid staff. It works like this: even if you have the best technology and the best design in the world, a social website is by definition useless if no one uses it. The result is that nobody wants to be the first to enter a newly launched online community. Catherina Fake, CEO of the photo sharing website Flickr, found a clever workaround: she asked her employees to use the site after they had built it. In this way, the first “real” users that wandered in found a website already populated with people who were passionate about photography – they were also paid employees of the company, but this might not have been obvious to the casual surfer. So the newcomers stayed in and enjoyed it, making the website even more attractive for other newcomers, kickstarting a virtuous cycle. With more than 50 million registerered users, now Flickr presumably does not need its employees to stand in as users any more.

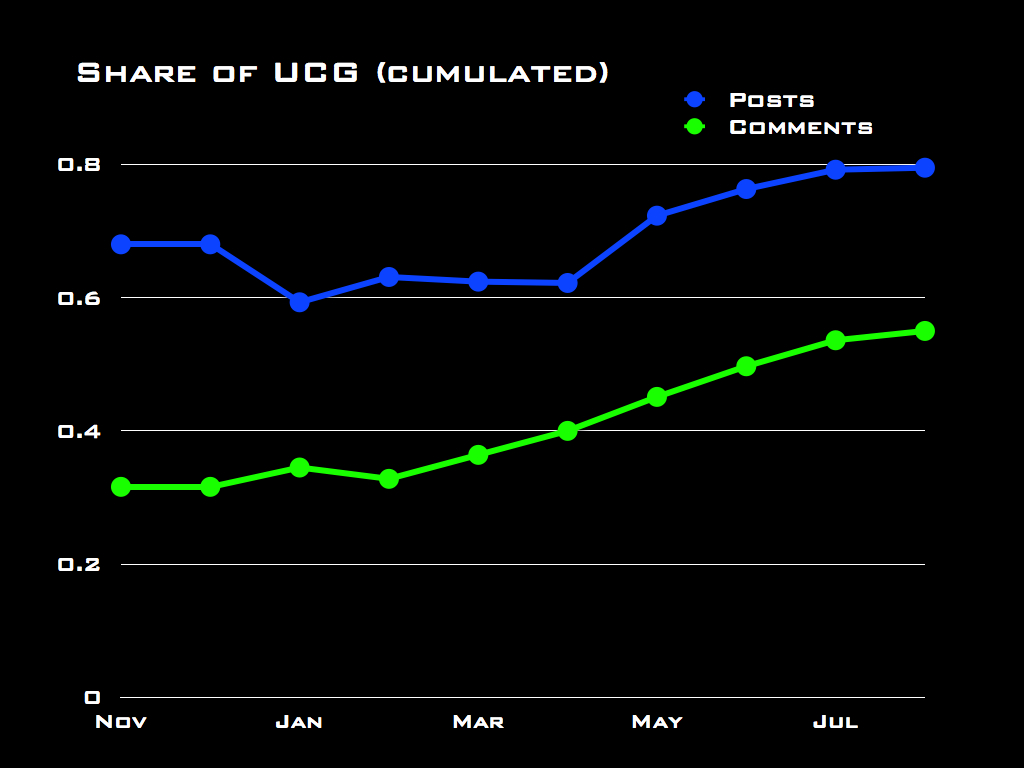
Let me share with you some data from Edgeryders. This project, just like many others, employs a small team of animators to prime the pump of the online conversation. Think of it as a blogging community with writing assignments: people participate by writing essays on the proposed topics, and by commenting one another’s submission. At the time I took the measurement (July 19th 2012) there were 478 posts with 3,395 comments in the Edgeryders database. The community had produced a vast majority of the posts – 80% exactly – and a much smaller majority of the comments – 55%. Over time, the community evolved much as one would expect: the role of the paid team in generating the platform’s content is much stronger at the beginning, and then it declines over time as the community gets up to speed. So, the share of community-generated content over the total is clearly increasing (see the chart above). Activity indicators in absolute terms have also increased quite fast until June, then dropped in July as a part of a (planned) break while the research team digests results. In this perspective, the Edgeryders community seems to display signs of being at least partly sustainable, and of its sustainability increasing. However, I would like to suggest a different point of view.

When talking about the sustainability of an online community, a relevant question is: what is it that is being sustained? In a community like Edgeryders (and, I would argue, in many others that are policy-oriented) it is conversation. The content being uploaded on the platform is not a gift from the heavens; rather it is both a result of an ongoing dialogue among participants and its driver. As long as the dialog keeps going, it keeps appearing in the form of new content. So, a better way to look at sustainability is by looking at the conversation as a network and asking what would happen to that conversation if the team were removed from it.

We can address this question precisely in a quantitative way with network analysis. My team and I have extracted network data from the Edgeryders database. The conversation network is specified as follows:

  • users are modeled as nodes in the network
  • comments are modeled as edges in the network
  • an edge from Alice to Bob is created every time Alice comments a post or a comment by Bob
  • edges are weighted: if Alice writes 3 comments to Bob’s content an edge of weight 3 is created connecting Alice to Bob

Thus specified, the Edgeryders network in mid-July 2012 consists of 3,395 comments, and looks like this:
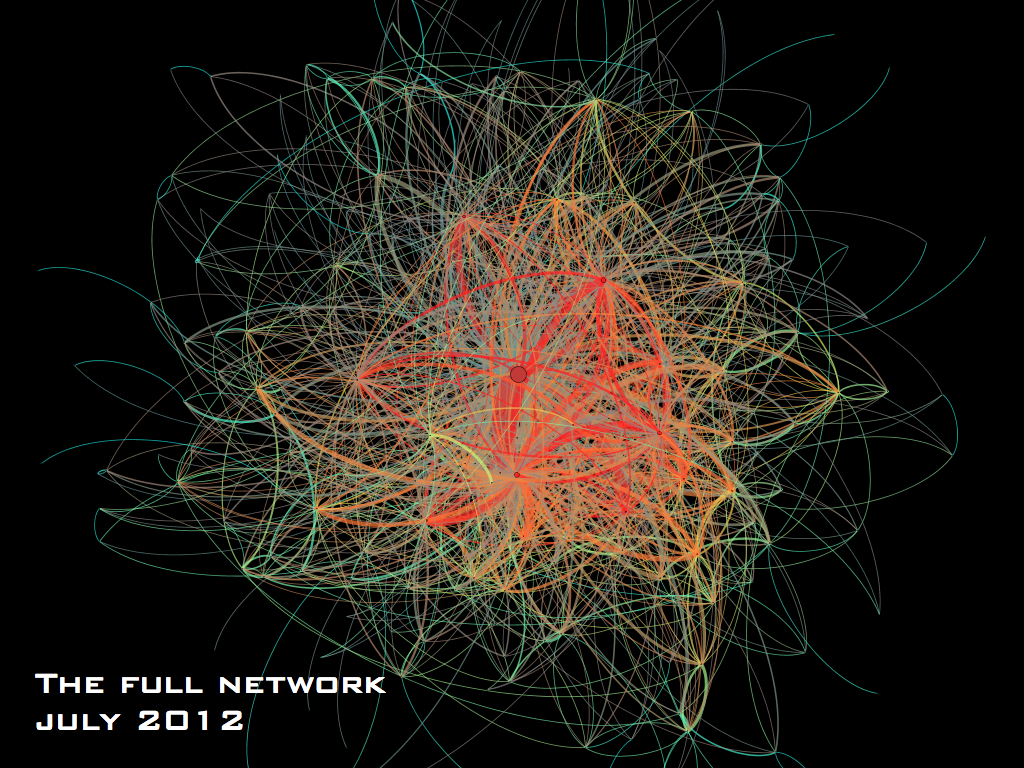
Colors represent connectiveness: the redder nodes are more connected (higher degree). What would happen to the conversation if we suddenly removed the contribution of the Edgeryders team? This:
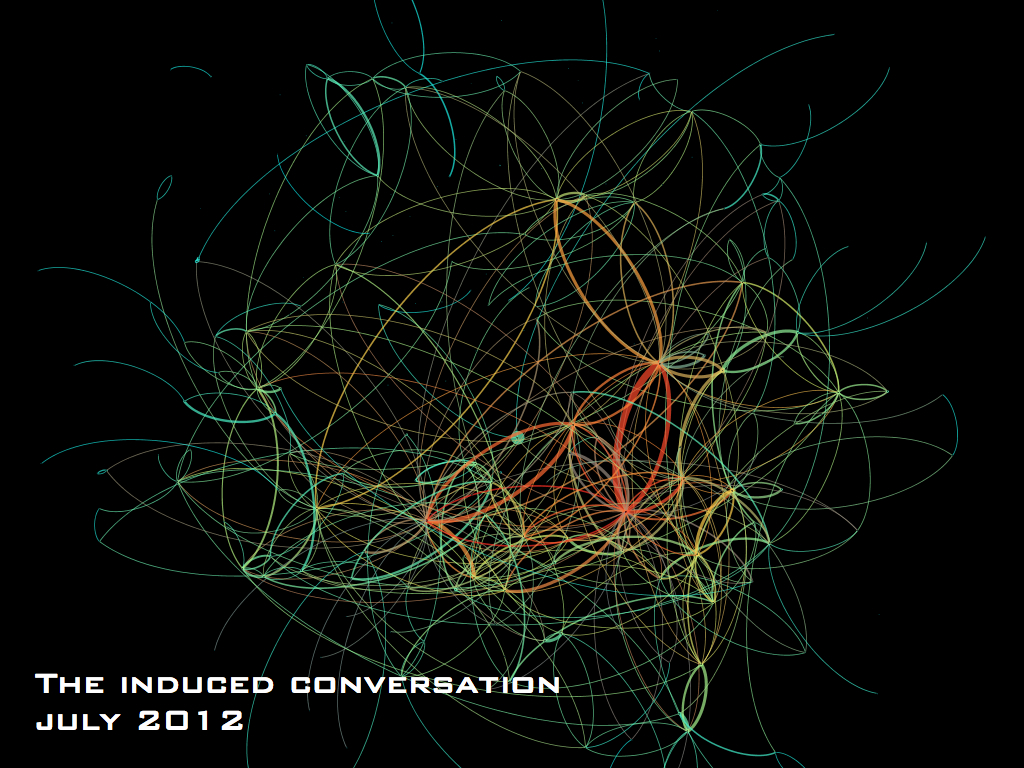


I call this representation of an online community its induced conversation. It selects only the interactions that do not involve the members of the team – and yet it is induced in the sense that these interactions would not have happened at all if the community managers had not created a context for them to take place in.

Even from simple visual inspection, it seems clear that the paid team plays a large role in the Edgeryders conversation. Once you drop the nine people that, at various stages, received a compensation to animate the community all indicators of network cohesion drop. An intuitive way to look at what is happening is:

  • the average active participant in the full Edgeryders network interacts directly with 6.5 other people (this means she either comments or receives comments from 6.5 other members on average). The intensity of the average interaction is a little over 2 (this means that, on average, people on Edgeryders exchange two comments with each person they interact with). Dropping the team members, the average number of interactants per participant drops to 2.4, and the average intensity of interactions to just above 1.5. Though most active participants are involved in the induced conversation, for many of them the team members are an important part of what fuels the social interactions. Dropping them is likely to change significantly the experience of Edgeryders, from a lively conversation to a community where one has the feeling she does not know anyone anymore.
  • more than three quarters of active participants do interact with other community members. However, only a little more than one third of the interactions happens between non-team community members, and do not involve the team at all. Notice how these shares are lower than the shares of community generated vs. team generated content.
  • 49 out of 219 non-team active members are “active singletons”: they do contribute to user-generated content, but they only interact with the Edgeryders team. Removing the latter means disconnecting these members from the conversation. There is probably a life-cycle effect at work here: new members are first engaged by the team, which then tries to introduce the newcomers to others with similar interest. This is definitely what we try to do in Edgeryders, and I have every intention to use longitudinal data to explore the life-cycle hypothesis at some later stage.
  • the average distance from two members is 2.296 in the full network, but increases to 3.560 when we drop the team. The team plays an important role in facilitating the propagation of information across the network, by shaving off more than one degree of separation on average.

From an induced conversation perspective, it seems unlikely that the Edgeryders community could be self-sustaining. The willingness of its members to contribute content lies at least in part on the role played by its team in sustaining the conversation, making the experience of participating in Edgeryders much more rewarding even in the presence of a small number of active users.

That said, it seems that the community has been moving towards a higher degree of sustainability. If we look at the share of the Egderyders active participants that take part in the induced conversation, as well as the share of all interactions that constitute the induced conversation itself, we find clear upward trends:
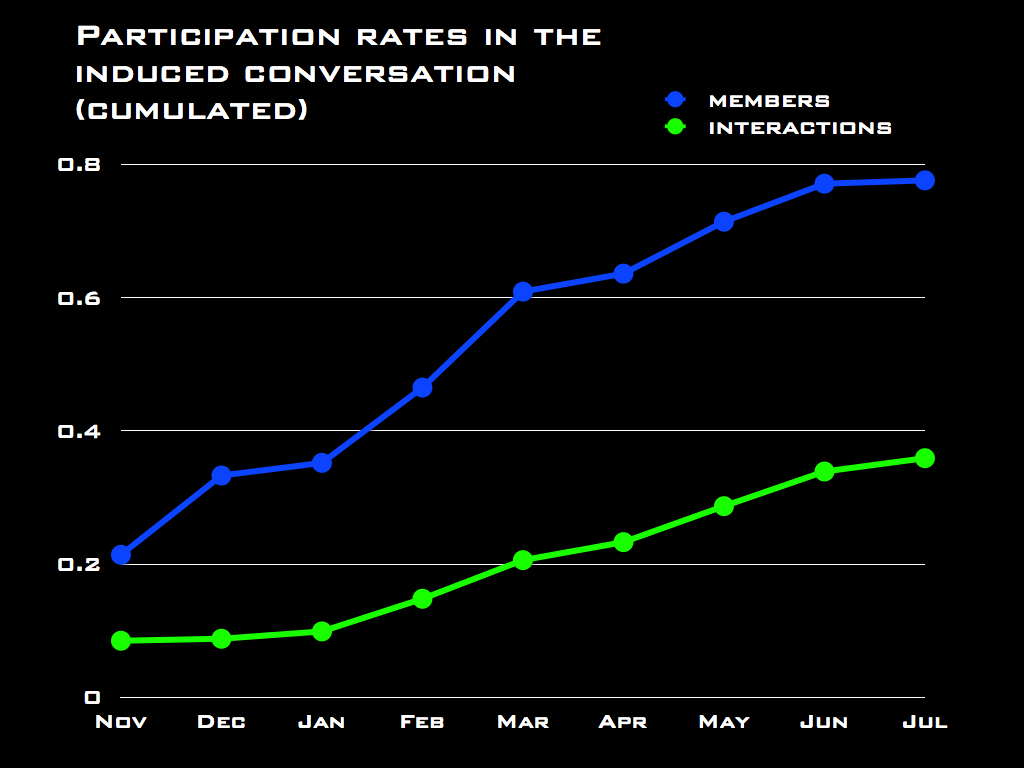

Based on the above, I would argue that these data can be very helpful in making management decisions that concern sustainability. If you find yourself in a situation like that of Edgeryders in July and you run out of funding, for example, my recommendation would be to “quit while you are ahead”: shut the project down in a very public way while participants have a good perception of it rather than letting it die a slow death by the removal of its team. On the other hand, if you are trying to achieve a self-sustainable community, you might want to target indicators like average degree, average intensity of the interactions (weighted degree), average distance and rates of participation to the induced conversation, and try out management practices until you have established which ones affect your target indicators.

It’s trial and error, I know, but still a notch up the total steering by guts prevailing in this line of work. And it will get better, if we keep at it. Which is why I am involved in building Dragon Trainer.

See also: how online conversations scale. Forthcoming: another post on conversation diversity, all based on the same data as this.

Come scalano le conversazioni online, e perché questo è importante per le politiche pubbliche

Ho a cuore le politiche pubbliche, e cerco di contribuire al loro miglioramento. Sto esplorando l’Internet sociale come strumento per collegare i cittadini tra loro e alle istituzioni, analizzare i problemi di governance, progettarne soluzioni e realizzarle – il tutto in modo decentralizzato. Ho scritto un libro per mostrare che è stato fatto, e argomentare che si dovrebbe farlo più spesso.

Non è una discussione facile. Molti decisori rimangono scettici: cosa ci garantisce che la discussione online converga verso un consenso basato su argomenti razionali e dati empirici? Un ristretto numero di persone con un metodo di lavoro comune possono formare un gruppo efficace, ma grandi masse di cittadini diversi tra loro e autoselezionati sono destinate a crollare sotto il peso di controversie, trolling e puro e semplice sovraccarico informativo. Abbiamo esempi di casi in cui questo non è successo, ma non abbiamo una teoria a guidarci nella progettazione di ambienti per la conversazione che producano i risultati voluti. Non è abbastanza.

Recentemente ho fatto un po’ di ricerche che potrebbero aprire uno spiraglio. Si tratta di un’analisi di rete della conversazione su Edgeryders. L’ho scritta in inglese – la trovate qui sotto. Per chi non legge l’inglese ma fosse interessato: non esitare a metterti in contatto con me, è facile trovarmi in rete (basta anche lasciare un commento qui). Nel video qui sopra (anch’esso in inglese) si trova un’analisi più dettagliata dei dati e una visualizzazione carina della crescita della rete.

How online conversations scale, and why this matters for public policies

I care about public policies, and try to contribute to their betterment. The road I am exploring is to take advantage of the social Internet to connect citizens among themselves and with government institutions to assess governance problems, design solutions and implement them – all in a decentralized fashion. I wrote a book to show it has been done, and to argue for it to be done more.

But it remains a tough sell. Many decision makers remain skeptical: why should online conversations converge onto evidence-based consensus? A few people who share a common work method can make an effective group, but a large number of very diverse and self-selected citizens – what I have been arguing for – is likely to collapse under the weight of trolling, controversy and sheer information overload. We have examples in which this did not happen: but we don’t have a theory to guide us in designing conversation environment which produce the desired results. Not good enough.

Some work I have been doing recently might provide a lead. As the director of Edgeryders, I marveled at the uncanny ability of that community to process complex problems – as I had done many times before in my years as a participant to online conversations. But this time I had access to the database, and – together with my colleagues at the Council of Europe and the Dragon Trainer project – I used it to reconstruct a full model of the Edgeryders conversation as a network. The network works like this:

  • users are modeled as nodes in the network
  • comments are modeled as edges in the network
  • an edge from Alice to Bob is created every time Alice comments a post or a comment by Bob
  • edges are weighted: if Alice writes 3 comments to Bob’s content an edge of weight 3 is created connecting Alice to Bob

I looked at the growth over time of the Edgeryders network as defined above, by taking nine snapshots at 30 days intervals, working backwards from July 17th 2012. For each snapshot I looked at four parameters:

  1. number of connected components (“islands” in the network)
  2. Louvain modularity of the network. This parameter identifies the network’s subcommunities and computes the difference between its subcommunities structure and what you would expect in a random network. Modularity can take any value between 0 and 1: higher values indicate a topology that is unlikely to emerge by chance, so they are the signature that some force is giving the network its actual shape; low values mean that the breakdown into subcommunities is weak, and could well have emerged by chance.
  3. for modularity values indicating significance (above 0.4), the number of subcommunities in which the network is broken down by the Louvain algorithm

These indicators for Edgeryders agree that there is no partitioning in the network. All active members are connected in one giant component, whose modularity values stay consistently low (around 0.3-0.2) throughout the period analyzed. This is not surprising: my team at Edgeryders had clear instructions to engage all newcomers into the conversation, commenting their work (and therefore connecting them to the giant component). From a network perspective, the job of the team was exactly to connect every user to the rest of the community, and this means compressing modularity.

Next, I looked at the induced conversation, the network of comments that were not by nor directed towards members of the Edgeryders team. It includes conversations that the Council of Europe got “for free”, without involving paid staff – and in a sense the most diverse, and therefore the most interesting. To do this, I dropped from the network the nodes representing myself and the other team members and recomputed the four parameters above. Results:

  • there is a significant number of “active singletons”, active nodes that are only talking to the team members, but not to each other. This might indicate a user life cycle effect: when a new user becomes active, she is first engaged by a member of the paid team, who tries to facilitate her connection to the rest of the community (by making introductions etc. My team has specific instructions to do this). The percentage of active singletons decreases over time, from about 10% to less than 5%.
  • not counting active singletons, there are several components in the induced conversation network. A giant component emerges in February; from that moment on, the number of components is roughly constant.
  • the modularity of the induced conversation network (excluding singletons) is high throughout the observation period (over 0.5),
  • the modularity of the giant component is also high throughout the period (over 0.5). Interestingly, modularity grows in the November-April period, indicating self-organization of the giant component. In February it crosses the 0.4 significance threshold
  • the number of subcommunities in which the Louvain algorithm partitions the giant component also grows over time, from 3 in April to 11 in July

The Edgeryders induced conversation network

Subcommunities are color coded. Knowing Edgeryders and being part of its community (and having access to non-anonymized data), I can easily see that some of those subcommunities correspond to subjects of conversation. For example, the yellow group in the upper part of the graph is involved in a web of conversation about the Occupy movement and how to build and share a pool of common resources. Also, looking at the growth of the graph over time, subcommunities seem to grow sequentially more than simultaneaneously. This might be related to the management structure of Edgeryders: we launched campaigns (roughly one every four weeks) to explore broad issues that have to do with the transition of youth to adulthood. Examples of issues are employment/income generation and learning. So, an interpretation could be this: each campaign summoned users interested in the campaign’s issue. These users connected to each other in clusters of conversation, and some of them act as “bridges” across the different cluster, giving rise to a connected, yet highly modular structure. The video above has some nice visualizations of the network’s growth and of the most relevant metrics.

This looks very much like parallel computing (except this computer is made of humans), and could be the engine of scalability. As more people join, online conversation does not necessarily become unmanageable: it could self-organize into clusters of conversation, increasing its ability to process a certain issue from many angles at the same time. Also, this interpretation is consistent with the idea that such an outcome can be helped by appropriate community management techniques.

Ten years ago, Clay Shirky warned us that communities don’t scale. He was right, by his own definition of community – which is what in network terms is called a clique, a structure in which everybody is connected to everybody else. I would argue, however, his definition is not the most appropriate to online communities. Communities do scale, by self-organizing into structures of tight clusters only weakly connected to each other.

If we could generalize what happens in Egderyders, the implications for online policies would be significant. It would mean we can attack almost any problem by throwing an online community at it; and that we can effectively tune how smart our governance is by recruiting more citizens. appropriately connected, into it. We at the Dragon Trainer project are following this line of investigation and developing tools for data-powered online community management. If you care about this issue too, you are welcome to join us onto the Dragon Trainer Google Group; if you want to play with Edgeryders data, you can find them on our Github repository.

Coming soon: posts about conversation diversity and community sustainability based on the same data.