Tag Archives: online conversations

Looking for the mathematical signature of engagement policies in online communities

(Disclaimer: this is very very preliminary, a far cry from a publishable result. I am doing open notebook science here, in case some genius out there has some useful suggestion!)

Evolution of networks of online conversations

A growing literature on evolving networks finds that degree distributions of a great many real world networks follow power laws (survey article). The mathematical explanation goes more or less as follows: if a network grows according to a mechanism that has some preferential attachment in it (for example: M new links are generated at each period, of which N connect to existing nodes at random and M-N connect to existing nodes by preferential attachment), this network will end up with a pure power law degree distribution. The presence of non-preferential attachment components in the growth mechanism will affect the exponent of the power law, but not the shape of the distribution itself.

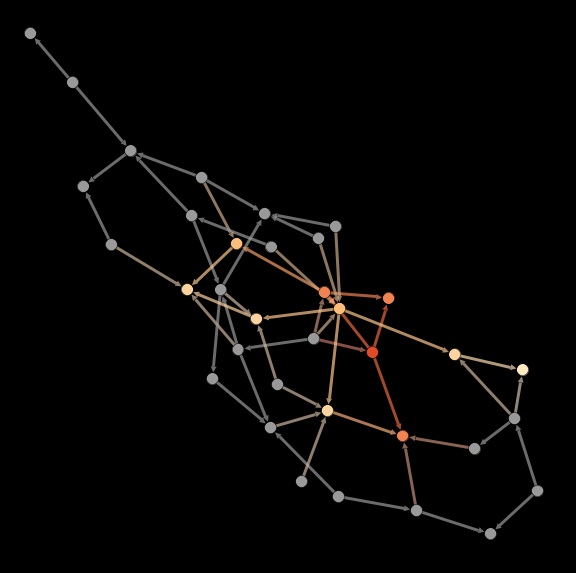
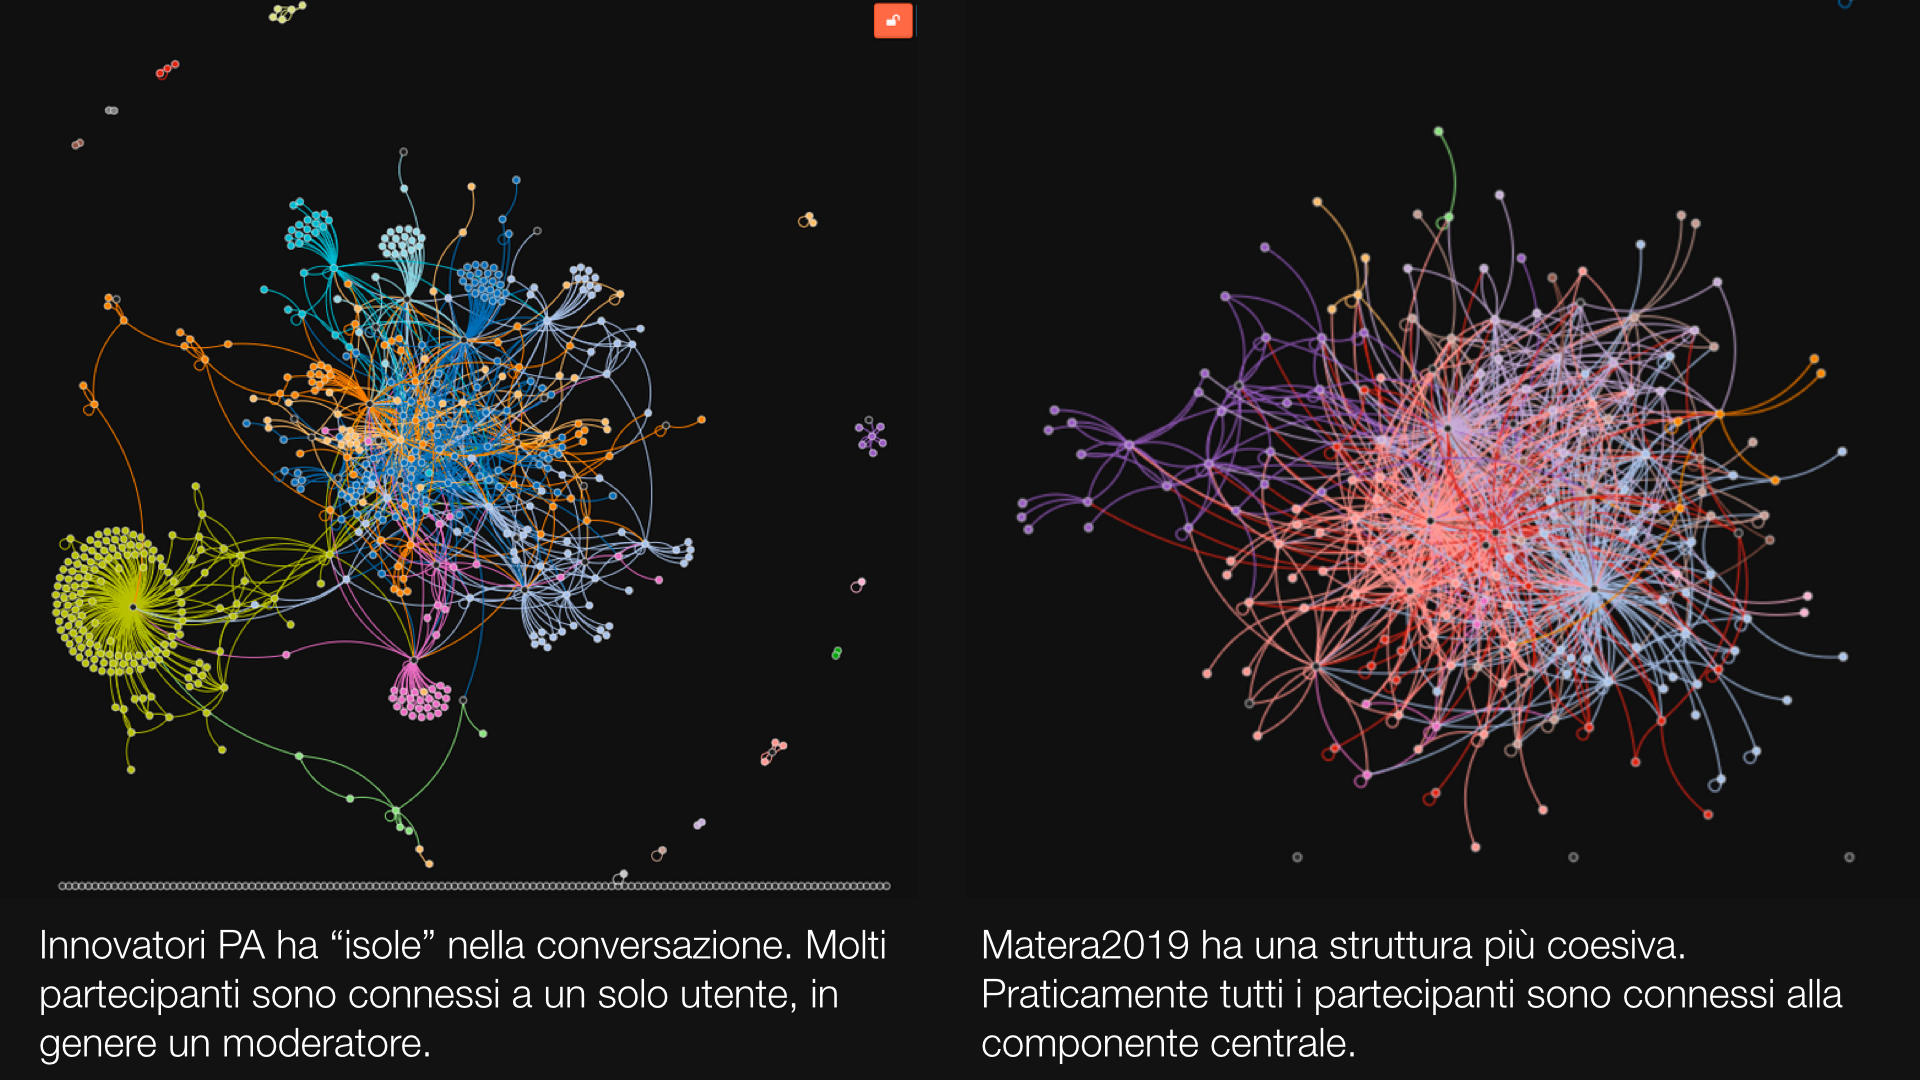
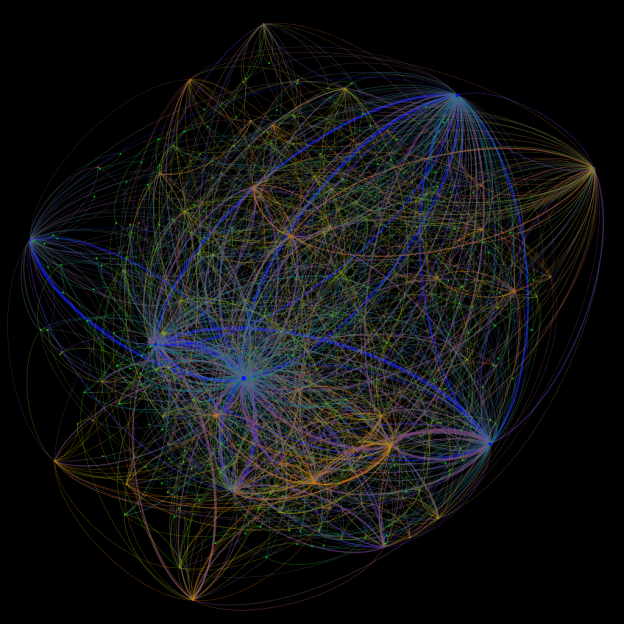
It seems reasonable that there should be at least some preferential attachment in online conversation networks. As new members join, many of them will reach out to someone, and it seems to make sense that they will target highly connected individuals more. So, we should expect online conversation networks to display a power law degree distribution. On the other hand, in the course of testing Edgesense, it became apparent that the conversation networks different online communities have very different topologies:

Edgesense_comparison.001

Methodology

Anecdotically, these two communities differ by many things, but I am especially interested in moderation policies. Innovatori PA (left) has no special moderation policy; different people are responsible for what they call “communities” (the database sees them as groups), and each of them does what feels appropriate. Matera 2019 (right) is run as per a relatively tight “no user left behind” policy: moderators are instructed to go comment each and every new user. I can’t prove directly that the moderation policy is responsible for the difference in network shape (I have no counterfactual), but what I can do is the following:

  1. Test that the degree distribution of a moderated conversation does NOT follow a power law.
  2. Make an educated guess as to how the policy is expected to “distort” the degree distribution. For example, the idea behind “no user left behind” is that users who get comments by moderators will become more active, leaving more comments than they would otherwise do (I already confirmed this by panel data econometric techniques). More comments translate into more edges in the network. Since this policy only applies to new members (established members do not need encouragement to take part in the conversation). we expect it to influence only low-degree nodes.
  3. If the network’s degree distribution does not follow a power law, we know that some mechanism is at work, and it is so much stronger than preferential attachment as to drown it into noise. If the educated guess is also confirmed, we have an indication that the policy might be responsible for it – but not a proof that it is.

I test this with the Edgeryders conversation network. On November 10th, 2014, Edgeryders had 596 active users (“active” in the sense of having authored at least one post or comment); just over 3,000 posts; and over 12,000 comments. Comments induce edges: Anna is connected to Bob if she has commented at least one of Bob’s posts or comments (comments are threaded in Edgeryders, so users can comment other users’s comments). The induced network is directed and weighted, with 596 nodes and 4,073 edges.

My educated guess is as follows:

  1. Fewer nodes have degree 0. These would be users that become active with a post (they are not commenting anyone with their first action in the community); the policy says these should be commented, and if they are they should have degree 1.
  2. Fewer nodes have degree 1. These would be users who become active with a comment, and therefore they have degree 1 upon appearance in the community. At that point, one of the moderators would comment them, therefore pushing their degree up to 2.
  3. Both these effects would be compounded, with some probability, by the finding that people who receive comments tend to become more active. So, you would expect to see some users that would have degree 0 or 1 in a non-moderated community be pushed not only to degree 1 and 2 respectively, but to a degree greater than 2. So, we expect more users to have a minimum degree n equal to or greater than 2 and above than in a non-moderated (but otherwise identical) online community. The value of n depends on how well the policy works in prompting users to get more active: if it works well enough, n could be 3, 4, or even more. This situation produces a “hump” at in the expected empirical degree distribution with respect to the theoretical pure power law one.
  4. We also expect this hump to level off. As users become active members of the community, they are no longer the object of special attention by moderators. At this point, they become subject to the usual dynamics of preferential attachment, or whatever dynamics really regulate the growth of an online conversation.
  5. If effective, this policy also makes moderators very highly connected. This effect is trivial for out-degree, but we should observe it for in-degree too, as some of the connections moderators make to new users will be reciprocated.

Findings

I use Jeff Alstott’s Power Law Python package to examine the distribution and follow’s Alstott method of testing comparative goodness-of-fit across alternate distributions. The results are as follows.

The power law distribution does not seem like a good fit for the whole dataset. This conclusion holds across in-degree, out-degree and in- and out-degree distributions. In what follows I focus on the in-degree distribution, because it is the one where preferential attachment seems most likely to exert a strong influence. I do not drop moderators, because users cannot influence their own in-degree (except for self-loops, which I drop from the data, reducing the number of edges to 3903); this allows me to test also for item 5 in the previous list. In-degree in the data so reduced varies from 0 to 234.

However, when we fit a power law distribution only to the curve describing nodes with degree 4 or above, we find a much better fit. Cutting the curve at degree 4 minimizes the Kolmogorov-Smirnov distance between the fitted line and the data.

Following Alstott’s recommendations, I tested the goodness-of-fit of the power law distributions against two alternative candidate distributions: the exponential and the lognormal. Testing against an exponential has the sense of testing whether the empirical distribution is heavy-tailed at all: the exponential having a better fit than the power law would indicate little support in the data for preferential attachment as a growth mechanism of the network. Testing against a lognormal is a successive step: once it has been determined that the empirical data indeed follow a fat-tailed distribution – a clear superiority of the power law’s fit would indicate strong support for the preferential attachment hypothesis. Unfortunately, this does not go two ways: a superior lognormal fit by itself would probably not be enough to reject the preferential attachment hypothesis (it is famously difficult to tell these two distributions apart. The controversy on lognormal vs. power law distributions of real world networks started immediately after Barabasi and Albert’s 2005 Nature article.)

Here are the results. Statistical significance is highlighted in blue and given as p-values (0.01 means 99% significance). 

Whole dataset  
Exponential Lognormal
Power law vs. Exponential (0.604) Lognormal (1.25 x 10⁻¹⁸)
Exponential vs.  //  Lognormal (0.024)
Degree >= 4  
Exponential Lognormal
Power law vs. Power law (0.004) Lognormal (0.268)
Exponential vs.  //  Lognormal (0.002)

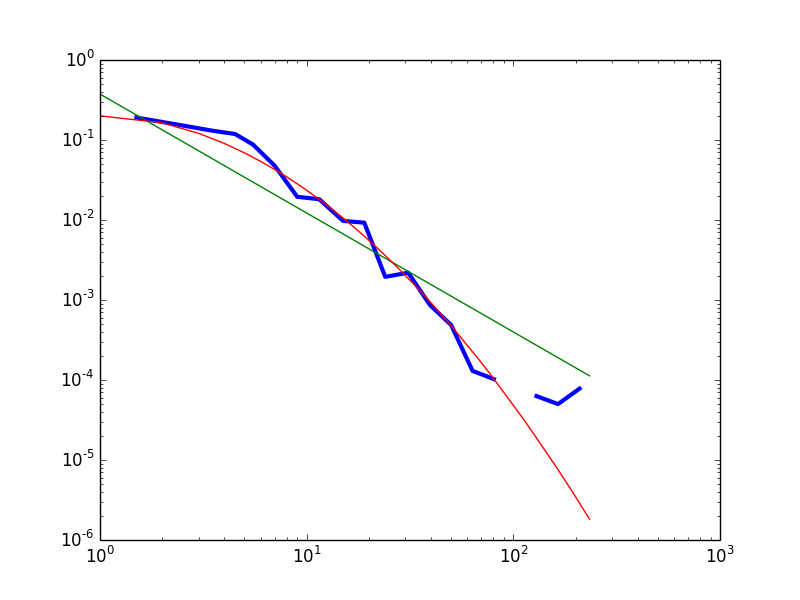
Fig.1 – The empirical data (blue) compared with a fitted power law (green) and lognormal (red) distributions. The best fit exponential is not reported because it drops much faster in the tails, and so makes the rest of the picture unreadable.

Provisionally, I conclude that the data do carry some support for the distribution to be heavy-tailed. However, a power law is not a good fit for the left part of the distribution. 

The “hump” in the head of the distribution seems indeed to be present. Visual inspection of the whole dataset’s empirical distribution (degree >= 1) reveals that the power law distribution overestimates the frequency of nodes with degree 1; underestimates the frequency of nodes with degree 2 to 25; then overestimates the frequency of highly connected nodes (inDegree > 25). The “hump” is less pronounced, but still there, with respect to the best fit lognormal: the lognormal slightly overestimates the correctly frequency of nodes with degree 1 and 2; underestimates the frequency of nodes with degree 3 to 7; then predicts correctly enough the frequencies of nodes with degree 8 to 80; then underestimates the heaviness of the tail.

An alternative approach is to consider the distribution as a power law with noise in the head and in the tail. In Figure 2 I plot the empirical frequency density curve for degree >= 4 against the best-fit power law distribution. This has the advantage of not requiring ad hoc arguments to justify the choice of a lognormal as the distribution of choice (it might appear we are overfitting).

In both cases, we can conclude that the data are compatible with the theoretical prediction of a power law distribution, except for very low values of the degree variable. The moderation policy followed in Edgeryders aims to make being weakly connected a temporary condition, by encouraging users to get more deeply involved in the conversation – and therefore more strongly connected. Weakly connected nodes can be interpreted either as new users, on their way to acquiring more links, or as “fossiles” – users on which the policy did not work.

Edgeryders_powerlaw_XMin4

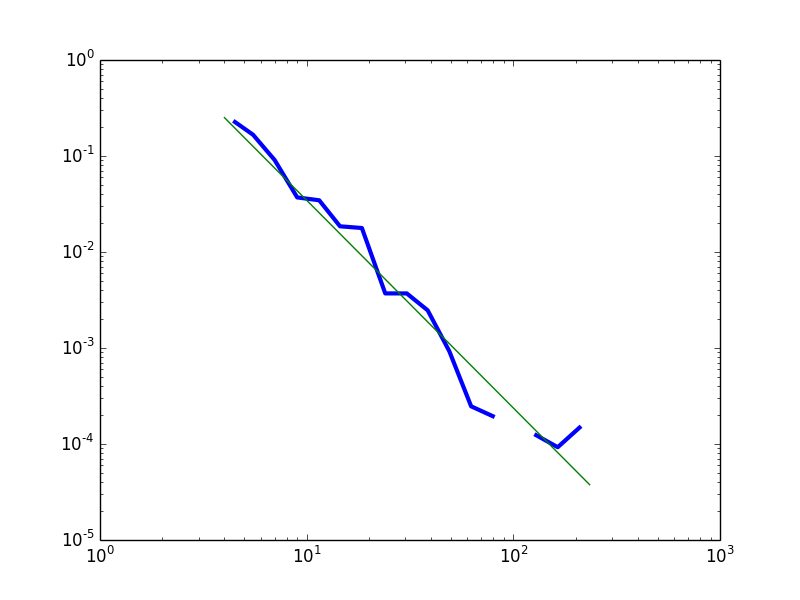
Fig.2 – The empirical data (blue) compared with a fitted power law (green) for degree >= 4.

How to make progress?

This is an encouraging first pass on the data, but I would like to “harden” the testing. Is there a way to mathematically predict the precise shape of the degree distribution for low degrees, based on the policy and the generic prediction of a power law distribution. Does anyone have any suggestions?

The Edgeryders conversation network in December 2012

Farming online conversations: assessing moderators impact with panel data econometrics (long)

Online communities have been my Swiss army knife for the best part of a decade. I tend to throw an online community at every problem I face – and that’s not limited to work: even my wedding party was organized that way.

We all know online communities have interesting properties, but how much can we control them? Can we “farm” them, growing one around each problem we are interested in? How expensive is this likely to be? These questions are relevant for my work, because we can’t use them as tools, as I tend to do, without some degree of control on them. I simply need to know if my intuition of online communities as general purpose collective intelligence tools is grounded, or if I am just delusional. As part of obsessing on this problem, two years ago I started a semi-structured research project, which is supposed to become a Ph.D. thesis. Some of the results are now in: the executive summary is that there seems to be evidence for our ability to artificially grow an online conversation about a specific problem.

Data source: the Council of Europe’s Edgeryders

I am using data from a project called Edgeryders. It was meant as a “distributed think tank”, an attempt to grow and harvest a large-scale online conversation around the task of building a proposal for reform European youth policy. The project was led by the Council of Europe and co-funded by the European Commission; it took place between late 2011 and the end of 2012. I was its director, as I worked at the Council of Europe at the time.

Edgeryders was based on an online interactive platform; its database if the source of all data described in this post. It worked like this: my team would ask it research questions grouped by topics (topics were broad issues like employment and income generations, education and learning etc.). Anyone was free to join and provide answers in the form of blog posts. All such blog posts were commentable for validation. By the end of the exercise, it had about 1200 registered users. Most were “lurkers” who never wrote anything on the platform. Those that did contribute were 260; collectively they wrote 500 posts and over 4000 comments. This material was analyzed by ethnographers, who used it to construct a publication on youth issues as seen from the youth themselves. The researchers obviously found Edgeryders material relevant for the task at hand. This, however, does not per se prove that we could really “farm” an online conversation around the issue of youth policy: maybe we simply intercepted a need to discuss the issue, and our efforts to grow and steer the conversation were in vain, or even counterproductive.

A small team of moderators devoted part of their time to encouraging users to share and discuss their point of view using positive reinforcement. This was a policy in the strict sense of the word: they were paid and instructed to engage users, especially first-time ones (“Hey, X, this is really interesting!”) ; ask them questions conducive to extracting issue-relevant information from the conversation; and connect them with other users with similar interests or approaches. Sometimes this would happen spontaneously, as the members of the Edgeryders community engaged one another; but when this did not happen by itself within hours of somebody writing a new post, the team of moderators was tasked with “breaking the ice.”

Modelling strategy

To assess the impact of the policy on the conversation, we proceed as follows. First, we model the Edgeryders conversation as a social network, whose nodes are active users and whose edges are comments. The network is directed: user i is connected to user j if i has commented some content (one or more posts or comments) written by j (comments are threaded in Edgeryders, so users can comment another comment). This was done by

  • using Datasource on the (Drupal) Edgeryders platform to extract relevant information from the database in JSON form;
  • writing a Python script to read the data and build the Edgeryders network, in conjunction with Tulip for graph analysis.

With dynamic network analysis still in its infancy, the main challenge to address this question was how to capture the time dimension of the data. I adopted the approach of “slicing” the course of the project into 57 one-week time periods, ranging from late October 2011 to December 2012. For each period I extracted the corresponding subgraph, using the following conventions:

  • “edges don’t die”. Let user i comment user j‘s content for the first time in period t. The edge from i to j appears in all graphs described from period t onwards. The interpretation of this convention is that, by interacting, i and j transform their relationships (among other changes, i is giving j a more or less explicit permission to interact with him or her) and this transformation is permanent in the context of the project (about one year).
  • nodes appear from the period in which they first create their Edgeryders account, even if they will only write their first contribution in subsequent periods. Nodes corresponding to not-yet active users will of course show up in the network as singletons, whereas nodes corresponding to users that will never become active are simply dropped from the network.

The final subgraph has 260 nodes and 4041 edges, many of them parallel to each other(same source and destination, different dates).

Once I had the slices, I needed a model of individual user behaviour that I could run against the data. The natural thing to do, with network data, would be to stay with a network approach, and estimate

 \forall i,j \in N P(e_i,j,t)|S_t

Where N is the number of nodes P(e_i,j,t) is the probability of user i forming an edge e_i,j at time t and S_t denotes the state of the system in terms of non-network variables at t. Unfortunately, this is not computationally viable. So, I collapsed network information into a vector of variables attached to each user, and allow it to vary over time. This transforms the problem into one of estimating

 A_i,t = f(A_{j \ne i, t}, EgoNetwork_{i,t} ,GlobalNetwork_{i,t} )

where:

  • A_i,t is the activity of user i at time t
  • A_{j \ne i, t} is the activity of other users at t
  • EgoNetwork_{i,t} is a vector of ego network variables (for example in-degree and clustering coefficient)
  • GlobalNetwork_{i,t} is a vector of global network variables (like density and modularity).

Once ego- and global network metrics have been computed for each time slice, this problem is tractable by panel data statistical techniques. Incidentally, notice that the relatively small size of each time slice – only one week – was chosen to capture the signal of the many lagged variables I had to use to avoid endogeneity issues. This, however, has the flip side of making most users inactive at most periods (13710 observations out of 14820 take value zero). This makes the dependent variable almost, but not quite, binary (taking value “nothing” in most cases and “something” in the rest). Therefore, the estimate was computed using a negative binomial model with fixed effects. This model estimates mostly the effect of regressors on activation (the probability of users to become active), but – unlike fully binary models like logits – it also uses the extra information encoded in users writing more than a post or comment in a given period.

An even more fundamental flip side is that this “flattening” of the network into a vector loses key information about the identity of who is connected with whom. In this first iteration, I kept track of whether inbound and outbound comments for each user come from moderators or non-moderators. Other refinements can be added.

Results

Preliminary data exploration shows evidence of structural change in early April 2012 (period 21). This corresponds to the date when a major Edgeryders conference, to be held in June the same year, was announced. People involved in the project confirm that this announcement was a game-changer in the project, as it made the Edgeryders proposition to its community much clearer and more credible – we referred to it as “addressing the what’s-in-it-for-you question”. We promised to cover travel expenses for about 50 contributors to the platform to get together in Strasbourg and flesh out the policy document that the Council of Europe would then advocate with respect to the European Commission and its own member states. We could spot structural differences across three subsets of the data: the first one describing activity in the interval before period 21; the second one describing activity of “old” users (who became active before period 21) after period 21; and the third one describing activity of users who became active in periods 21 and later.

The results of our negative binomial estimation for the whole dataset and for each of the three subsets are visible below.

To a first approximation, these results hold two lessons.

  1. Policy works. In all subsets as well as in the whole dataset receiving comments by moderators as well as by non-moderator community members has a positive and strongly significant impact (p-value < 0.01). This result is unambiguous.
  2. The network’s shape influences activity. All models show strongly significant influence of some variables capturing the shape of users’ ego networks as well as the global network. This is nontrivial, because some of these variables, like modularity, cannot be perceived directly, even by the most attentive users, without access to the database and network analysis software. However, these results are (still) ambiguous, and not consistent across subsets of data.

Implications

Result 1 has clear implications for online community managers running collective intelligence exercises. It says that user activity propagates across the conversation network, with each user receiving an impulse from in-neighbours and retransmitting it with its own input added (with some probability) to its out-neighbours. This is consistent with this paper by Nathan Hodas and Kristina Lerman, who find that contagion models explain well the spreading of information across online social networks after accounting for meme visibility as constructed by the designers of the online social networks themselves. The overall picture is reminescent of neural networks, a topic that I know little; it might be worth exploring this similarity further, as neural networks are in a sense a natural modelling choice for collectively intelligent organizational arrangements.

Contagion in a random directed network. Starting from the bright red node in the center (the moderator), the signal travels across the network.

Contagion in a random directed network. Starting from the bright red node in the center (the moderator), the signal travels across the network.

In a policy perspective, the result is saying that you can indeed “farm” an online conversation  by deploying one or more moderators/animators to interact with users. It works like this: a moderator engages directly some users; this increases the probability that they will become active; if they become active, this increases the probability that these first users out-neighbours will also become active and so on. This confirms anecdotal evidence: for example, as Shirky relates (source), photo sharing web 2.0 company Flickr deployed its own employees as the first users of the website, so that, when unpaid users came online, they found a lively conversation going on. Caterina Fake, Flickr’s CEO, reportedly remarked “You have to great the first ten thousand users personally”.

For online community managers, such a policy has two attractive properties.

  1. Firstly, there is a sort of multiplier effect: moderators activate users, whose activity in turn activates other users – remember, the coefficients on both comments received by moderators and comments received by non-moderators is strongly significant.
  2. Secondly, it does not matter which users in particular are targeted by moderators initially, because the activation signal propagates across the network according to some contagion model (video). To a first approximation, propagation will be limited only by the size of the strongly connected component that the signal starts in (though of course the size and topology of the giant component is itself endogenous to user activity; by becoming active, users can choose to activate new edges). Most real-life social networks tend to evolve towards a topology that features a giant component gathering a large share of all participants. In December 2012, the Edgeryders conversation network featured a giant strongly connected component that gathered more than 50% of active users. 100% of active users were part of a weakly connected giant component.

So, the model’s implications for the community managers wishing to “farm” an online conversation around a specific topic can be translated into two simple rules:

  1. Deploy moderators to engage users. This policy increases activity.
  2. Try to connect users with other users. This policy increases connectivity and, critically, the size of the network’s giant component. Moderators in Edgeryders were instructed to do just that, trying to match new users to existing ones on the basis of their first contributions (“Hey, Anna, this is really interesting! Something similar, but with a very different slant, has been proposed by Bob at this link…”).

The more activity and connectivity there are in the network, the less the conversation needs moderator effort to keep going. This is not so intuitive, and indeed online community managers tend to think it is the number of users, not the number of connections among them, that drive a conversation towards being self-sustaining. Again, if true this is excellent news for people who, like me, deploy online networks to attack problems by a collective intelligence approach, because it implies that you can get nearly self-sustaining (hence cheap to maintain) conversations even with relatively small networks, in the hundreds of low thousands of active users. This is because the potential connections in a graph grow quadratically with respect to the number of its nodes, so for a given level of performance, moderators can reduce costs both by attracting new users and by connecting existing users to each other.

What to monitor?

In the context of the CATALYST project, I am involved in an effort to build easy-to-install social network analysis software for common CMSs. Based on the above discussion, what should this software monitor? I would suggest:

  1. a visualization mode that makes it easy to tell the activity of moderators from that of non-moderators.
  2. the number of strongly connected components,  making sure that moderators engage each one.
  3. the size of the largest strongly connected component, both absolute and relative to the conversation network, as an indicator of conversation self-sustainability.

What do you think?

I wish to acknowledge the role of the Council of Europe in launching the project and firing me to lead it; of the University of Alicante, the INSITE project and IUAV for supporting my research; and to Giovanni Ponti, Luigi Di Prinzio, Guy Melançon, Benjamin Renoust and Raffaele Miniaci for their invaluable help and generosity. Financial support from the Spanish Ministerio de Economía y Competitividad (ECO2012-34928) is gratefully acknowledged.