Highly innovative economies are characterised by intense cooperation between academia and industry. It makes sense: university researchers are good at discovery and invention, industry engineers are good at product and business development. Together, they have more chances of coming up with innovative products and bringing them to market. So, many governments would like to see more of it. They have rolled out policies to encourage academics and business people to work together across the culture chasm.
Horizon 2020 is one such policy. With its 80 billion Euro budget, it is the European Union’s flagship research and innovation funding programme. It is an interesting point of observation on cooperation between industry and academia because of its size, and also because it grants funding not to individual organisations, but to consortia. Each consortium is an opportunity for academia and industry to work together. To what extent do European universities and companies seize those opportunities? How effective is Horizon 2020 in bringing together academia and industry?
With my sisters- and brothers-in-arms in the Spaghetti Open Data community we have tried to address these questions. We started this work as a hackathon track at Open Data Fest, in June 2017. Here’s what we did it and what we found out.
What we did
- Fortunately, the data on funding under Horizon 2020 are open. We downloaded the CORDIS dataset from the European Open Data Portal. Our dataset includes 16,592 organisations and 11,068 projects.
- We used them to induce a network. Its nodes are the 16,592 organisations. Two organisations are connected by an edge if they participated in at least one project together. There turn out to be 493,014 edges in this network.
- We filtered the network to include what we call “stable partnerships”. Two organisations are said to have a stable partnership if they participated together in at least two Horizon 2020 projects. Organisations that have no stable partners were dropped. This yielded a network with 3,414 nodes, and 46,632 edges. It is important to note that, for computational reasons, there are two edges for each connected pair of organisations (A, B) in the network: one that connects A to B and the other that connects B back to A. Edges can be interpreted as decisions to build a stable partnership: A has decided to participate in more projects in which B is present, and B has made the same decision with regard to A.
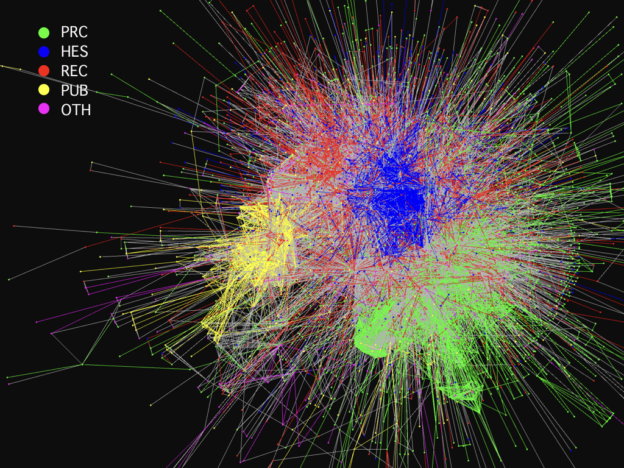
- CORDIS data distinguish between five types of organisations: private companies (PRC) , higher education establishments (HES), research organisations (REC), public sector (PUB) and others (OTH). With this information, we could look at the patterns of partnership generation within and across types of organisations.
What we learned
Organisations in Horizon 2020 show a marked preference for partnering with other organisations of the same type. This pattern of behaviour is called assortativity, and is common in many social networks. However, it plays out in very different ways across different types of organisations.
| Type | % edges w/orgs of same type (actual) | % edges w/orgs of same type (random) | % Difference |
|---|---|---|---|
| PRC | 45 | 40 | +5 |
| HES | 59 | 18 | +41 |
| REC | 38 | 22 | +16 |
| PUB | 46 | 10 | +36 |
| OTH | 14 | 8 | +6 |
| ALL | 46 | 26 | +20 |
The second column of this table shows how many within-type partnerships we actually observe. Organisations of type PRC (companies) choose to partner up with other PRCs 45% of the times. Organisations of type HES (universities) choose to partner up with other HESs 59% of the times, and so on.
The third column show what these percentages would be if organisations were to chose partners at random from the population of Horizon 2020 participants. Choosing partners at random of course makes no sense: but it gives us a useful mathematical benchmark to compare our observations against. Companies, for example, account for 40% of all the organisations in the stable partnership network: so, if they choose a partner at random, they will pick another company 40% of the times. The difference between observed choice and random choice (45% – 40% = 5%) is a measure of the preference for in-type partnership of each type of organisations.
This preference is strong for the network in general, but weak for companies and very strong indeed for public sector organisations and, especially, universities. You can perceive it visually, by looking at the picture that opens this post: edges are grey when they connect partners of different types. When they connect partners of the same type, take the color of that type, shown in the legend. There are very clear clusters of public sector organisations (yellow) and, right in the center of the action, universities (blue).
These organisations obviously see some advantage in investing mostly on partnerships within their own “tribe”. This tendency is an indicator the width of the cultural chasm that academics and business people need to overcome if they are to work together.
How effective is the set of incentives incorporated in Horizon 2020 in overcoming it? Not very effective, it turns out. Out of the 46,632 edges in the stable partnership networks, only 3,254 (7%) involve one company and one university. This is exactly half of the partnerships of this type you would get if organisations were to choose their partners at random. To give a visual appreciation of this, we drew the network, and coloured the edges connecting universities and company in red.
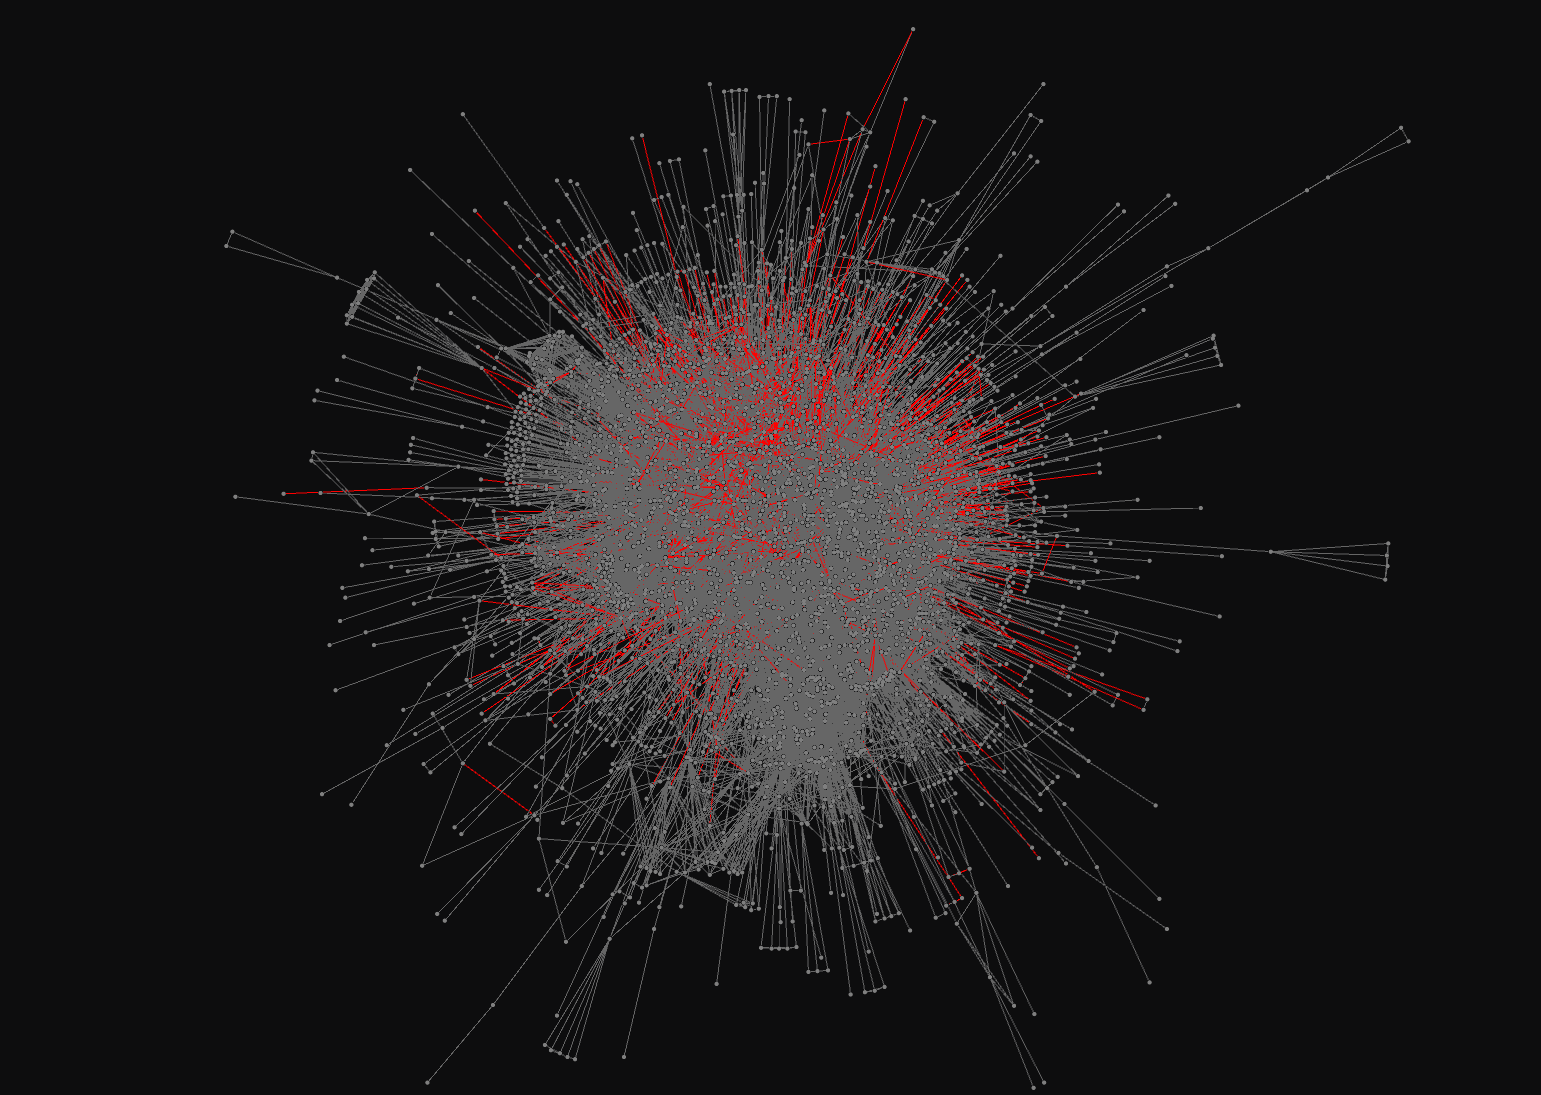
The giant component of the Horizon 2020 stable partnership graph. Red edges encode a partnership between a university and a company.
Thanks to Open Data Sicilia (especially the mighty Giuseppe La Mensa) and Spaghetti Open Data for organising the hackathon. Thanks to Baya Remaoun, web and data manager at CORDIS, for her support.
Code, data and images are available on GitHub. You can find a more detailed explanation of this and other paths of exploration across the CORDIS dataset on the wiki. You are free to use this post and the GitHub repo under the terms of the respective licenses, but if you want to write a paper about this please consider involving me as a co-author.